Development Helpers
Xdebug's development helpers allow you to get better error messages and
obtain more information from PHP's built-in functions. The helpers
include an upgraded var_dump() function; location,
stack, and argument information upon Notices, Warnings and
Exceptions; and numerous functions and settings to tweak PHP's
behaviour.
Contents
- An improved
var_dump()function - Stack Traces upon Errors and Warnings
- Functions to obtain information about the running script
Improved var_dump() function #
Xdebug changes PHP's built-in var_dump() function to be
HTML-formatted, and includes information about location. The
overloaded var_dump() is active in HTML contexts (when
PHP's html_errors setting is 1), as well as on the
command line.
HTML Context
Without Xdebug loaded, and a <pre> tag artificially added:
array(4) {
  ["one"]=>
  string(23) "a somewhat long string!"
  ["two"]=>
  array(1) {
    ["two.one"]=>
    array(2) {
      ["two.one.zero"]=>
      int(210)
      ["two.one.one"]=>
      array(2) {
        ["two.one.one.zero"]=>
        float(3.141592564)
        ["two.one.one.one"]=>
        float(2.7)
      }
    }
  }
  ["three"]=>
  object(test)#1 (3) {
    ["pub"]=>
    *RECURSION*
    ["priv":"test":private]=>
    bool(true)
    ["prot":protected]=>
    int(42)
  }
  ["four"]=>
  array(6) {
    [0]=>
    int(0)
    [1]=>
    int(1)
    [2]=>
    int(2)
    [3]=>
    int(3)
    [4]=>
    int(4)
    [5]=>
    int(5)
  }
}
With Xdebug loaded, it will output this instead:
/tmp/var_dump.php:23:
array (size=4)
  'one' => string 'a somewhat long string!' (length=23)
  'two' =>
    array (size=1)
      'two.one' =>
        array (size=2)
          'two.one.zero' => int 210
          'two.one.one' =>
            array (size=2)
              ...
  'three' =>
    object(test)[1]
      public 'pub' =>
        &object(test)[1]
      private 'priv' => boolean true
      protected 'prot' => int 42
  'four' =>
    array (size=6)
      0 => int 0
      1 => int 1
      2 => int 2
      3 => int 3
      4 => int 4
      5 => int 5
The changes are:
- It has automatically added
<pre>tags. - It shows the file/line combination where
var_dump()was called from./tmp/var_dump.php:23
- The formatting is more concise, due to that array key and type are on the same line.
- Added a distinct colour per data type.
- It has limited the depth of nested levels.
array (size=2)
  ...
- Indicated to which object the recursion was.
&object(test)[1]
There are a number of settings that change control how much output is shown and/or hidden. These settings are:
- xdebug.var_display_max_data
- controls how large strings can be before they're truncated, and shown with elipsis (…).
- xdebug.var_display_max_depth
- controls how many levels deep into a data structure information is shown.
- xdebug.var_display_max_children
- controls how many array elements or object properties are shown.
Command Line
The overloaded var_dump() is also active on the command line, and
reacts to the same configuration settings with regards to what is shown in the
HTML context. By default it does not show colours, but this can be turned on by
setting xdebug.cli_color to 1.
That turns:
/tmp/var_dump2.php:12:
array(2) {
  'one' =>
  string(23) "a somewhat long string!"
  'three' =>
  class test#1 (3) {
    public $pub =>
    bool(false)
    private $priv =>
    bool(true)
    protected $prot =>
    int(42)
  }
}
Into:
/tmp/var_dump2.php:12:
array(2) {
  'one' =>
  string(23) "a somewhat long string!"
  'three' =>
  class test#1 (3) {
    public $pub =>
    bool(false)
    private $priv =>
    bool(true)
    protected $prot =>
    int(42)
  }
}
Stack Traces #
When Xdebug is loaded, it overrides PHP's standard error handler callbacks, and provides one that also shows a stack trace. These stack traces contain a list of all the functions and method that were called between the start of the script and where the error occurred. An example of such a stack trace is:
| ( ! ) Fatal error: Maximum execution time of 1 second exceeded in /home/httpd/html/test/xdebug/docs/stack.php on line 70 | ||||
|---|---|---|---|---|
| Call Stack | ||||
| # | Time | Memory | Function | Location |
| 1 | 0.0007 | 374160 | {main}( ) | .../stack.php:0 |
| 2 | 0.0010 | 376752 | foo( $a = array (42 => FALSE, 'foo' => 9121240, 43 => class stdClass { public $bar = 100 }, 44 => class stdClass { }, 45 => resource(3) of type (stream)) ) | .../stack.php:84 |
| Variables in local scope (#2) | ||||
$a = | /home/httpd/html/test/xdebug/docs/stack.php:70: array (size=5) 42 => boolean false 'foo' => int 9121240 43 => object(stdClass)[1] public 'bar' => int 100 44 => object(stdClass)[2] 45 => resource(3, stream) | |||
$i = | /home/httpd/html/test/xdebug/docs/stack.php:70:int 3047104 | |||
This is an example of a stack trace with only some of the optional features
turned on. The "Variables in local scope" section will only show when you set
xdebug.show_local_vars to 1.
Here follows a list with settings that change the information that is shown in a stack trace:
- xdebug.dump_globals
- xdebug.dump_once
- xdebug.dump_undefined
- xdebug.dump.*
- xdebug.dump_globals controls whether information from super globals is added to the stack trace. You can configure which super globals and keys are shown with the specific xdebug.dump.* settings, whether they shown only once with xdebug.dump_once, and whether to include undefined super global keys with xdebug.dump_undefined.
- xdebug.file_link_format
- The format of the generated link in the
Location column:
.../stack.php:84 - xdebug.filename_format
- Which part(s) of the path to show in the Location column.
- xdebug.max_stack_frames
- How many stack frames to show
- xdebug.show_local_vars
- Whether to include the available variables from the scope of the last called user defined function.
- xdebug.var_display_max_data
- xdebug.var_display_max_depth
- xdebug.var_display_max_children
- How much information to include for arguments to function calls and local variables. These are the same settings as used for improved var_dump() function.
Two more settings control whether Xdebug should show stack traces even when an Error or Exception has been caught:
You can find more detailed information for each setting in their own documentation section.
Filtering #
Xdebug includes filtering capabilities for stack traces. A filter either includes, or excludes, paths or class name prefixes (namespaces). You can use a filter to prevent anything from a vendor directory to appear in a stack trace, or to only include classes from specific namespaces.
To set-up a filter that shows only functions and methods that either have no class name, or are prefixed with "Xdebug", you would call xdebug_set_filter() with:
Filter Example
xdebug_set_filter(
	XDEBUG_FILTER_STACK,
	XDEBUG_NAMESPACE_INCLUDE,
	[ '', 'Xdebug' ]
);
With this filter set-up, you will only see functions (without class) and all
method calls of classes that start with "Xdebug". This includes built-in PHP
functions (such as strlen()) and calls to
XdebugTest::bar(). The filter does not enforce that "Xdebug" is
the name of a namespace, and only does a strict character comparison from the
start of the fully qualified class name. Add a \ to the prefix to
make sure only classes in the Xdebug\ namespace are included.
The full documentation for the arguments to xdebug_set_filter() are described on its own documentation page.
Related Settings and Functions #
- integer xdebug.cli_color = 0
- string xdebug.dump.* = Empty
- boolean xdebug.dump_globals = true
- boolean xdebug.dump_once = true
- boolean xdebug.dump_undefined = false
- string xdebug.file_link_format =
- string xdebug.filename_format = ...%s%n
- integer xdebug.force_display_errors = 0
- integer xdebug.force_error_reporting = 0
- integer xdebug.halt_level = 0
- string xdebug.log =
- integer xdebug.log_level = 7
- integer xdebug.max_nesting_level = 512
- integer xdebug.max_stack_frames = -1
- string xdebug.mode = develop
- boolean xdebug.scream = false
- integer xdebug.show_error_trace = 0
- integer xdebug.show_exception_trace = 0
- integer xdebug.show_local_vars = 0
- string xdebug.trigger_value = ""
- integer xdebug.var_display_max_children = 128
- integer xdebug.var_display_max_data = 512
- integer xdebug.var_display_max_depth = 3
- var_dump() : void
- xdebug_call_class() : mixed
- xdebug_call_file() : mixed
- xdebug_call_function() : mixed
- xdebug_call_line() : mixed
- xdebug_debug_zval() : void
- xdebug_debug_zval_stdout() : void
- xdebug_dump_superglobals() : void
- xdebug_get_collected_errors() : array
- xdebug_get_function_count() : int
- xdebug_get_headers() : array
- xdebug_info() : mixed
- xdebug_memory_usage() : int
- xdebug_peak_memory_usage() : int
- xdebug_start_error_collection() : void
- xdebug_stop_error_collection() : void
- xdebug_time_index() : float
- xdebug_var_dump() : void
Settings #
integer xdebug.cli_color = 0 #
If this setting is 1, Xdebug will color var_dumps and stack traces output when in CLI mode and when the output is a tty. On Windows, the ANSICON tool needs to be installed.
If the setting is 2, then Xdebug will always color var_dumps and stack trace, no matter whether it's connected to a tty or whether ANSICON is installed. In this case, you might end up seeing escape codes.
See this article for some more information.
This setting can additionally be configured through the
XDEBUG_CONFIG
environment variable.
string xdebug.dump.* = Empty #
* can be any of COOKIE, FILES, GET, POST, REQUEST, SERVER, SESSION. These seven settings control which data from the superglobals is shown when an error situation occurs.
Each of those php.ini setting can consist of a comma separated list of
variables from this superglobal to dump, or * for all of them.
Make sure you do not add spaces in this setting.
In order to dump the REMOTE_ADDR and the REQUEST_METHOD when an error occurs, and all GET parameters, add these settings:
xdebug.dump.SERVER = REMOTE_ADDR,REQUEST_METHOD
xdebug.dump.GET = *
boolean xdebug.dump_globals = true #
When this setting is set to true, Xdebug adds the values
of the super globals as configured through the xdebug.dump.* to on-screen stack
traces and the error log (if enabled).
boolean xdebug.dump_once = true #
Controls whether the values of the superglobals should be dumped on all error situations (set to 0) or only on the first (set to 1).
boolean xdebug.dump_undefined = false #
If you want to dump undefined values from the superglobals you should set this setting to 1, otherwise leave it set to 0.
string xdebug.file_link_format = #
This setting determines the format of the links that are made in the display of stack traces where file names are used. This allows IDEs to set up a link-protocol that makes it possible to go directly to a line and file by clicking on the filenames that Xdebug shows in stack traces. An example format might look like:
myide://%f@%l
The possible format specifiers are:
| Specifier | Meaning |
|---|---|
| %f | the filename |
| %l | the line number |
For various IDEs/OSses there are some instructions listed on how to make this work:
PhpStorm
In the configuration file, add the following line, including the single quotes. This uses PhpStorm's REST API.
xdebug.file_link_format='javascript: var r = new XMLHttpRequest; r.open("get", "http://localhost:63342/api/file/%f:%l");r.send()'
Firefox on Linux
- Open about:config
- Add a new boolean setting "network.protocol-handler.expose.xdebug" and set it to "false"
- Add the following into a shell script
~/bin/ff-xdebug.sh:#! /bin/sh f=`echo $1 | cut -d @ -f 1 | sed 's/xdebug:\/\///'` l=`echo $1 | cut -d @ -f 2`
Add to that one of (depending whether you have komodo, gvim or netbeans):komodo $f -l $lgvim --remote-tab +$l $fnetbeans "$f:$l"
- Make the script executable with
chmod +x ~/bin/ff-xdebug.sh - Set the xdebug.file_link_format setting to
xdebug://%f@%l
Windows and Netbeans
- Create the file
netbeans.batand save it in your path (C:\Windowswill work):@echo off setlocal enableextensions enabledelayedexpansion set NETBEANS=%1 set FILE=%~2 set FILE=!FILE:%%5C=\! %NETBEANS% --nosplash --console suppress --open "%FILE:~19%" nircmd win activate process netbeans.exe
Note: Remove the last line if you don't have
nircmd. - Save the following code as
netbeans_protocol.reg:Windows Registry Editor Version 5.00 [HKEY_CLASSES_ROOT\netbeans] "URL Protocol"="" @="URL:Netbeans Protocol" [HKEY_CLASSES_ROOT\netbeans\DefaultIcon] @="\"C:\\Program Files\\NetBeans 7.1.1\\bin\\netbeans.exe,1\"" [HKEY_CLASSES_ROOT\netbeans\shell] [HKEY_CLASSES_ROOT\netbeans\shell\open] [HKEY_CLASSES_ROOT\netbeans\shell\open\command] @="\"C:\\Windows\\netbeans.bat\" \"C:\\Program Files\\NetBeans 7.1.1\\bin\\netbeans.exe\" \"%1\""
Note: Make sure to change the path to Netbeans (twice), as well as the
netbeans.batbatch file if you saved it somewhere else thanC:\Windows\. - Double click on the
netbeans_protocol.regfile to import it into the registry. - Set the xdebug.file_link_format setting to
xdebug.file_link_format =
"netbeans://open/?f=%f:%l"
string xdebug.filename_format = ...%s%n #
This setting determines the format with which Xdebug renders
filenames in HTML stack traces (default: ...%s%n) and location
information through the overloaded xdebug_var_dump() (default:
%f).
The possible format specifiers are listed in this table. The example output is
rendered according to the full path
/var/www/vendor/mail/transport/mta.php.
| Specifier | Meaning | Example Output |
|---|---|---|
| %a | Ancester: Two directory elements and filename | mail/transport/mta.php |
| %f | Full path | /var/www/vendor/mail/transport/mta.php |
| %n | Name: Only the file name | mta.php |
| %p | Parent: One directory element and the filename | transport/mta.php |
| %s | Directory separator | / on Linux, OSX and other Unix-like systems, \ on Windows |
integer xdebug.force_display_errors = 0 #
If this setting is set to 1 then errors will
always be displayed, no matter what the setting of PHP's display_errors
is.
integer xdebug.force_error_reporting = 0 #
This setting is a bitmask, like error_reporting. This bitmask will be logically ORed with the bitmask represented by error_reporting to dermine which errors should be displayed. This setting can only be made in php.ini and allows you to force certain errors from being shown no matter what an application does with ini_set().
integer xdebug.halt_level = 0 #
This setting allows you to configure a mask that determines whether, and which, notices and/or warnings get converted to errors. You can configure notices and warnings that are generated by PHP, and notices and warnings that you generate yourself (by means of trigger_error()). For example, to convert the warning of strlen() (without arguments) to an error, you would do:
ini_set('xdebug.halt_level', E_WARNING);
strlen();
echo "Hi!\n";
Which will then result in the showing of the error message, and the abortion
of the script. echo "Hi!\n"; will not be executed.
The setting is a bit mask, so to convert all notices and warnings into errors for all applications, you can set this in php.ini:
xdebug.halt_level=E_WARNING|E_NOTICE|E_USER_WARNING|E_USER_NOTICE
The bitmask only supports the four level that are mentioned above.
string xdebug.log = #
Configures Xdebug's log file.
Xdebug will log to this file all file creations issues, Step Debugging connection attempts, failures, and debug communication.
Enable this functionality by setting the value to a absolute path. Make sure
that the system user that PHP runs at (such as www-data if you are
running with Apache) can create and write to the file.
The file is opened in append-mode, and will therefore not be overwritten by default. There is no concurrency protection available.
The log file will include any attempt that Xdebug makes to connect to an IDE:
[2693358] Log opened at 2020-09-02 07:19:09.616195
[2693358] [Step Debug] INFO: Connecting to configured address/port: localhost:9003.
[2693358] [Step Debug] ERR: Could not connect to debugging client. Tried: localhost:9003 (through xdebug.client_host/xdebug.client_port).
[2693358] [Profiler] ERR: File '/foo/cachegrind.out.2693358' could not be opened.
[2693358] [Profiler] WARN: /foo: No such file or directory
[2693358] [Tracing] ERR: File '/foo/trace.1485761369' could not be opened.
[2693358] [Tracing] WARN: /foo: No such file or directory
[2693358] Log closed at 2020-09-02 07:19:09.617510
It includes the opening time (2020-09-02 07:19:09.616195), the
IP/Hostname and port Xdebug is trying to connect to
(localhost:9003), and whether it succeeded (Connected to
client). The number in brackets ([2693358]) is the
Process ID.
It includes:
[2693358]- process ID in brackets
2020-09-02 07:19:09.616195- opening time
For Step Debugging:
INFO: Connecting to configured address/port: localhost:9003.
ERR: Could not connect to debugging client. Tried: localhost:9003 (through xdebug.client_host/xdebug.client_port).
For Profiling:
ERR: File '/foo/cachegrind.out.2693358' could not be opened.
WARN: /foo: No such file or directory
For Function Trace and Flame Graphs:
ERR: File '/foo/trace.1485761369' could not be opened.
WARN: /foo: No such file or directory
All warnings and errors are described on the Description of errors page, with
detailed instructions on how to resolve the problem, if possible. All errors are always logged through
PHP's internal logging mechanism (configured with error_log
in php.ini). All warnings and errors also show up in the
diagnostics log that you can view by calling xdebug_info().
Step Debugger Communication
The debugging log can also log the communication between Xdebug and an IDE.
This communication is in XML, and starts with the <init XML
element:
<init
    xmlns="urn:debugger_protocol_v1" xmlns:xdebug="https://xdebug.org/dbgp/xdebug"
    fileuri="file:///home/httpd/www.xdebug.org/html/router.php"
    language="PHP" xdebug:language_version="7.4.11-dev"
    protocol_version="1.0" appid="2693358" idekey="XDEBUG_ECLIPSE">
        <engine version="3.0.0-dev"><![CDATA[Xdebug]]></engine>
        <author><![CDATA[Derick Rethans]]></author>
        <url><![CDATA[https://xdebug.org]]></url>
        <copyright><![CDATA[Copyright (c) 2002-2020 by Derick Rethans]]></copyright>
</init>
The fileuri attribute lists the entry point of your
application, which can be useful to compare to breakpoint_set
commands to see if path mappings are set-up correctly.
Beyond the <init element, you will find the configuration of
features:
<- feature_set -i 4 -n extended_properties -v 1
-> <response
       xmlns="urn:debugger_protocol_v1" xmlns:xdebug="https://xdebug.org/dbgp/xdebug"
       command="feature_set" transaction_id="4" feature="extended_properties" success="1">
   </response>
<- step_into -i 9
-> <response
       xmlns="urn:debugger_protocol_v1" xmlns:xdebug="https://xdebug.org/dbgp/xdebug"
       command="step_into" transaction_id="9"
       status="break" reason="ok">
           <xdebug:message filename="file:///home/httpd/www.xdebug.org/html/router.php" lineno="3">
           </xdebug:message>
   </response>
You can read about DBGP - A common debugger protocol specification at its dedicated documation page.
The xdebug.log_level setting controls how much information is logged.
Many Linux distributions now use systemd, which
implements private tmp directories. This means that when PHP
is run through a web server or as PHP-FPM, the /tmp directory is
prefixed with something akin to:
/tmp/systemd-private-ea3cfa882b4e478993e1994033fc5feb-apache.service-FfWZRg
This setting can additionally be configured through the
XDEBUG_CONFIG
environment variable.
integer xdebug.log_level = 7 #
Configures which logging messages should be added to the log file.
The log file is configured with the xdebug.log setting.
The following levels are supported:
| Level | Name | Example |
|---|---|---|
| 0 | Criticals | Errors in the configuration |
| 1 | Errors | Connection errors |
| 3 | Warnings | Connection warnings |
| 5 | Communication | Protocol messages |
| 7 | Information | Information while connecting |
| 10 | Debug | Breakpoint resolving information |
Criticals, errors, and warnings always show up in the diagnostics log that you can view by calling xdebug_info().
Criticals and errors are additionally logged through
PHP's internal logging mechanism (configured with error_log
in php.ini).
This setting can additionally be configured through the
XDEBUG_CONFIG
environment variable.
integer xdebug.max_nesting_level = 512 #
Controls the protection mechanism for infinite recursion protection. The value of this setting is the maximum level of nested functions that are allowed before the script will be aborted.
When the maximum nesting level is reached, an "Error" exception is thrown.
Before Xdebug 3.3, the default value was 256.
integer xdebug.max_stack_frames = -1 #
Controls how many stack frames are shown in stack traces, both on the command line during PHP error stack traces, as well as in the browser for HTML traces.
string xdebug.mode = develop #
This setting controls which Xdebug features are enabled.
This setting can only be set in php.ini or
files like 99-xdebug.ini that are read when a PHP process starts
(directly, or through php-fpm). You can not set this value in
.htaccess and .user.ini files, which are read
per-request, nor through php_admin_value as used in Apache VHOSTs
and PHP-FPM pools.
The following values are accepted:
off- Nothing is enabled. Xdebug does no work besides checking whether functionality is enabled. Use this setting if you want close to 0 overhead.
develop- Enables Development Helpers including the overloaded var_dump().
coverage- Enables Code Coverage Analysis to generate code coverage reports, mainly in combination with PHPUnit.
debug- Enables Step Debugging. This can be used to step through your code while it is running, and analyse values of variables.
gcstats- Enables Garbage Collection Statistics to collect statistics about PHP's Garbage Collection Mechanism.
profile- Enables Profiling, with which you can analyse performance bottlenecks with tools like KCacheGrind.
trace- Enables the Function Trace and Flame Graphs features.
- The former allows you record every function call, including arguments, variable assignment, and return value that is made during a request to a file.
- The latter can be used to visualise certain performance characteristics.
You can enable multiple modes at the same time by comma separating their
identifiers as value to xdebug.mode: xdebug.mode=develop,trace.
XDEBUG_MODE environment variable
You can also set Xdebug's mode by setting the XDEBUG_MODE
environment variable on the command-line; this will take precedence over the
xdebug.mode setting, but will not change the value of the xdebug.mode
setting.
Some web servers have a configuration option to
prevent environment variables from being propagated to PHP and Xdebug.
For example, PHP-FPM has a clear_env
configuration setting that is on by default, which you will
need to turn off if you want to use XDEBUG_MODE.
Make sure that your web server does not clean the environment, or specifically
allows the XDEBUG_MODE environment variable to be passed on.
boolean xdebug.scream = false #
If this setting is 1, then Xdebug will disable the @ (shut-up) operator so that notices, warnings and errors are no longer hidden.
integer xdebug.show_error_trace = 0 #
When this setting is set to 1, Xdebug will show a stack trace whenever an Error is raised - even if this Error is actually caught.
integer xdebug.show_exception_trace = 0 #
When this setting is set to 1, Xdebug will show a stack trace whenever an Exception or Error is raised - even if this Exception or Error is actually caught.
Error 'exceptions' were introduced in PHP 7.
integer xdebug.show_local_vars = 0 #
When this setting is set to something != 0 Xdebug's generated stack dumps in error situations will also show all variables in the top-most scope. Beware that this might generate a lot of information, and is therefore turned off by default.
string xdebug.trigger_value = "" #
This setting can be used when xdebug.start_with_request is set to
trigger, which is the default for Step Debugging and Function Trace.
In trigger mode, Xdebug will only start its
functionality when the XDEBUG_TRIGGER is set in the environment,
or when the XDEBUG_TRIGGER GET, POST, or COOKIE variable is
set.
The legacy names XDEBUG_SESSION (for Step Debugging),
XDEBUG_PROFILE (for Profiling), and XDEBUG_TRACE
(for Function Trace) can also be used instead of XDEBUG_TRIGGER.
Normally, Xdebug does not look at which value is actually used. If this setting is set to a non-empty string, then Xdebug will only trigger if the value matches the value of this setting.
With the following settings:
xdebug.mode=profile
xdebug.start_with_request=trigger
xdebug.trigger_value=StartProfileForMe
Xdebug's profiler will only start when either the environment variable
XDEBUG_TRIGGER is set to StartProfileForMe, the GET
or POST variable XDEBUG_TRIGGER is set to
StartProfileForMe, or when the cookie XDEBUG_TRIGGER
has the value StartProfileForMe.
From Xdebug 3.1, it is possible to configure multiple values by using a comma separated list. In that case, Xdebug will trigger if the supplied value matches any of the entries that are configured through this setting:
xdebug.trigger_value=StartDebuggerForMe,StartDebuggerForYou
See also:
- xdebug.start_with_request#trigger
- For how the triggering mechanism works, and which environment and server variables Xdebug acts on.
integer xdebug.var_display_max_children = 128 #
Controls the amount of array children and object's properties are shown when variables are displayed with either xdebug_var_dump(), xdebug.show_local_vars or when making a Function Trace.
To disable any limitation, use -1 as value.
This setting does not have any influence on the number of children that is send to the client through the Step Debugging feature.
integer xdebug.var_display_max_data = 512 #
Controls the maximum string length that is shown when variables are displayed with either xdebug_var_dump(), xdebug.show_local_vars or when making a Function Trace.
To disable any limitation, use -1 as value.
This setting does not have any influence on the number of children that is send to the client through the Step Debugging feature.
integer xdebug.var_display_max_depth = 3 #
Controls how many nested levels of array elements and object properties are when variables are displayed with either xdebug_var_dump(), xdebug.show_local_vars or when making a Function Trace.
The maximum value you can select is 1023. You can also use -1 as value to select this maximum number.
This setting does not have any influence on the number of children that is send to the client through the Step Debugging feature.
Setting the value to a high number could potentially result in PHP using up all the available memory, so use with caution.
Functions #
var_dump( mixed ...$var ) : void #
Displays detailed information about a variable
This function is overloaded by Xdebug, see the description for xdebug_var_dump().
xdebug_call_class( int $depth = 2 ) : mixed #
Returns the calling class
This function returns the name of the class that defined the current method,
NULL if the stack frame does not exist, or FALSE if
no class is associated with this call.
Example:
<?php
class Strings
{
    static function fix_string($a)
    {
        echo
            xdebug_call_class().
            "::".
            xdebug_call_function().
            " is called at ".
            xdebug_call_file().
            ":".
            xdebug_call_line();
    }
}

$ret = Strings::fix_string( 'Derick' );
?>
Returns:
Called @ /home/httpd/html/test/xdebug_caller.php:17 from ::{main}
To retrieve information from earlier stack frames, use the optional
$depth argument. A value of 1 returns
the call information of the method that executed xdebug_call_class():
Example:
<?php
class Strings
{
    static function fix_string( $a )
    {
        echo
            xdebug_call_class( 1 ).
            "::".
            xdebug_call_function( 1 ).
            " is called at ".
            xdebug_call_file( 1 ).
            ":".
            xdebug_call_line( 1 );
    }
}

$ret = Strings::fix_string( 'Derick' );
?>
Returns:
Strings::fix_string is called at /home/httpd/html/test/xdebug_caller:17
A value of 2 (the default) returns the call information of the
"grand parent" of the current method:
Example:
<?php
class Strings
{
    static function fix_string( $a )
    {
        echo
            xdebug_call_class( 2 ).
            "::".
            xdebug_call_function( 2 ).
            " is called at ".
            xdebug_call_file( 2 ).
            ":".
            xdebug_call_line( 2 );
    }

    static function fix_strings( array $a )
    {
        foreach ( $a as $element )
        {
            self::fix_string( $a );
        }
    }
}

$ret = Strings::fix_strings( [ 'Derick' ] );
?>
Returns:
Strings::fix_strings is called at /home/httpd/html/test/xdebug_caller:25
A value of 0 returns the call information of the call to
corresponding xdebug_call_* method:
Example:
<?php
class Strings
{
    static function fix_string( $a )
    {
        echo
            xdebug_call_class( 0 ).
            "::".
            xdebug_call_function( 0 ).
            " is called at ".
            xdebug_call_file( 0 ).
            ":".
            xdebug_call_line( 0 );
    }

    static function fix_strings( array $a )
    {
        foreach ( $a as $element )
        {
            self::fix_string( $a );
        }
    }
}

$ret = Strings::fix_strings( [ 'Derick' ] );
?>
Returns:
::xdebug_call_function is called at /home/httpd/html/test/xdebug_caller:13
xdebug_call_file( int $depth = 2 ) : mixed #
Returns the calling file
This function returns the filename from where the current function/method
was executed from, or NULL if the stack frame does not exist
To retrieve information from earlier stack frames, use the optional
$depth argument.
For examples and more extensive information, see xdebug_call_class().
xdebug_call_function( int $depth = 2 ) : mixed #
Returns the calling function/method
This function returns the name of the current function/method, NULL if the stack frame does not exist, or FALSE if the stack frame has no function/method information
To retrieve information from earlier stack frames, use the optional
$depth argument.
For examples and more extensive information, see xdebug_call_class().
xdebug_call_line( int $depth = 2 ) : mixed #
Returns the calling line number
This function returns the line number from where the current function/method was
called from, or NULL if the stack frame does not exist
To retrieve information from earlier stack frames, use the optional
$depth argument.
For examples and more extensive information, see xdebug_call_class().
xdebug_debug_zval( string ...$varname ) : void #
Displays information about a variable
This function displays structured information about one or more variables that includes its type, value and refcount information. Arrays are explored recursively with values. This function is implemented differently from PHP's debug_zval_dump() function in order to work around the problems that that function has because the variable itself is actually passed to the function. Xdebug's version is better as it uses the variable name to lookup the variable in the internal symbol table and accesses all the properties directly without having to deal with actually passing a variable to a function. The result is that the information that this function returns is much more accurate than PHP's own function for showing zval information.
Support for anything but simple variable names (such as "a[2]" below) is supported since Xdebug 2.3.
Example:
<?php
    $a = array(1, 2, 3);
    $b =& $a;
    $c =& $a[2];

    xdebug_debug_zval('a');
    xdebug_debug_zval("a[2]");
?>
Returns:
a: (refcount=2, is_ref=1)=array (
	0 => (refcount=1, is_ref=0)=1,
	1 => (refcount=1, is_ref=0)=2,
	2 => (refcount=2, is_ref=1)=3)
a[2]: (refcount=2, is_ref=1)=3
xdebug_debug_zval_stdout( string ...$varname ) : void #
Returns information about variables to stdout
This function displays structured information about one or more variables that includes its type, value and refcount information. Arrays are explored recursively with values. The difference with xdebug_debug_zval() is that the information is not displayed through a web server API layer, but directly shown on stdout (so that when you run it with Apache in single process mode it ends up on the console).
Example:
<?php
    $a = array(1, 2, 3);
    $b =& $a;
    $c =& $a[2];

    xdebug_debug_zval_stdout('a');
Returns:
a: (refcount=2, is_ref=1)=array (
	0 => (refcount=1, is_ref=0)=1,
	1 => (refcount=1, is_ref=0)=2,
	2 => (refcount=2, is_ref=1)=3)
xdebug_dump_superglobals() : void #
Displays information about super globals
This function dumps the values of the elements of the super globals as specified with the xdebug.dump.* php.ini settings. For the example below the settings in php.ini are:
Example:
xdebug.dump.GET=*
xdebug.dump.SERVER=REMOTE_ADDR

Query string:
?var=fourty%20two&array[a]=a&array[9]=b
Returns:
| Dump $_SERVER | ||||
|---|---|---|---|---|
$_SERVER['REMOTE_ADDR'] = | string '127.0.0.1' (length=9) | |||
| Dump $_GET | ||||
$_GET['var'] = | string 'fourty two' (length=10) | |||
$_GET['array'] = | array 'a' => string 'a' (length=1) 9 => string 'b' (length=1) | |||
xdebug_get_collected_errors( bool $emptyList = false ) : array #
Returns all collected error messages
This function returns all errors from the collection buffer that contains all errors that were stored there when error collection was started with xdebug_start_error_collection().
By default this function will not clear the error collection buffer. If you pass
This function returns a string containing all collected errors formatted as an "Xdebug table".
xdebug_get_function_count() : int #
Returns the number of functions that have been called
This function returns the number of functions that have been called so far, including this function itself.
xdebug_get_headers() : array #
Returns all the headers as set by calls to PHP's header() function
Returns all the headers that are set with PHP's header() function, or any other header set internally within PHP (such as through setcookie()), as an array.
Example:
<?php
header( "X-Test", "Testing" );
setcookie( "TestCookie", "test-value" );
var_dump( xdebug_get_headers() );
?>
Returns:
array(2) {
  [0]=>
  string(6) "X-Test"
  [1]=>
  string(33) "Set-Cookie: TestCookie=test-value"
}
xdebug_info( string $category = null ) : mixed #
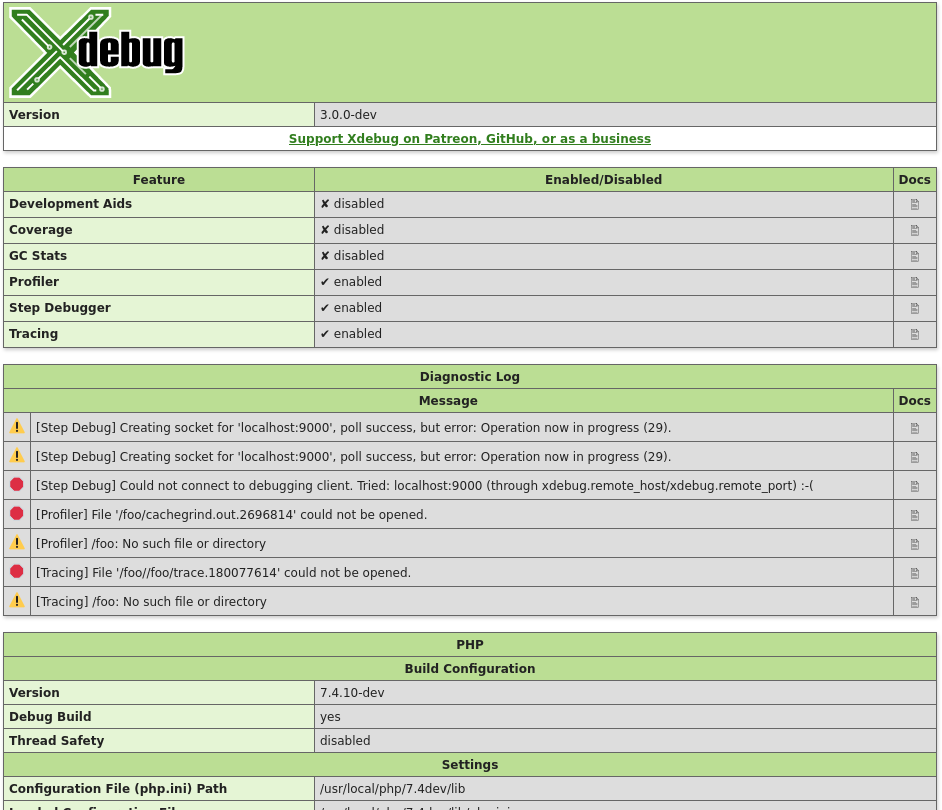
Show and retrieve diagnostic information
This function presents APIs to retrieve information about Xdebug itself. Which information gets returned, or displayed, depends on which arguments, or none at all, are given.
$category =
Without arguments, this function returns an HTML page which shows diagnostic information. It is analogous to PHP's phpinfo() function.
The HTML output includes which mode is active, what the settings are, and diagnostic information in case there are problems with debugging connections, opening of files, etc.
Each warning and error in the diagnostics log also links through to the Description of errors documentation page.
$category = 'mode' (New in Xdebug 3.1)
The function returns an array of all the
enabled modes, whether through xdebug.mode or the
XDEBUG_MODE environment variable.
Example:
<?php
var_dump( xdebug_info( 'mode' ) );
?>
Returns:
array(3) {
  [0] =>
  string(5) "debug"
  [1] =>
  string(7) "develop"
  [2] =>
  string(5) "trace"
}
$category = 'extension-flags' (New in Xdebug 3.1)
The function returns an array of all the compile flags that were enabled when
running ./configure as part of Xdebug's compilation process, and
all the system-specific detected features that effect Xdebug's behaviour.
If the compression flag is enabled, then the xdebug.use_compression
setting is available, and enabled by default.
Profiling and Function Trace will create GZip compressed files if the xdebug.use_compression setting is turned on (the default).
If the control-socket and tsc elements are present,
then Xdebug can be controlled with the Xdebug Control tool, as long as
xdebug.control_socket is not set to "off".
If the control-socket flag is present, but the tsc
flag is not present, then you must set xdebug.control_socket to
"time" deliberately for Xdebug Control to be able to interact
with Xdebug.
Example:
<?php
var_dump( xdebug_info( 'extension-flags' ) );
?>
Returns:
array(1) {
  [0] =>
  string(11) "compression"
  [1] =>
  string(14) "control-socket"
  [2] =>
  string(3) "tsc"
}
xdebug_memory_usage() : int #
Returns the current memory usage
Returns the current amount of memory the script uses. Before PHP 5.2.1, this only works if PHP is compiled with --enable-memory-limit. From PHP 5.2.1 and later this function is always available.
xdebug_peak_memory_usage() : int #
Returns the peak memory usage
Returns the maximum amount of memory the script used until now. Before PHP 5.2.1, this only works if PHP is compiled with --enable-memory-limit. From PHP 5.2.1 and later this function is always available.
xdebug_start_error_collection() : void #
Starts recording all notices, warnings and errors and prevents their display
When this function is executed, Xdebug will cause PHP not to display any notices, warnings or errors. Instead, they are formatted according to Xdebug's normal error formatting rules (ie, the error table with the red exclamation mark) and then stored in a buffer. This will continue until you call xdebug_stop_error_collection().
This buffer's contents can be retrieved by calling xdebug_get_collected_errors() and then subsequently displayed. This is really useful if you want to prevent Xdebug's powerful error reporting features from destroying your layout.
xdebug_stop_error_collection() : void #
Stops recording of all notices, warnings and errors as started by xdebug_start_error_collection()
When this function is executed, error collection as started by xdebug_start_error_collection() is aborted. The errors stored in the collection buffer are not deleted and still available to be fetched through xdebug_get_collected_errors().
xdebug_time_index() : float #
Returns the current time index
Returns the current time index since the starting of the script in seconds.
Example:
<?php
echo xdebug_time_index(), "\n";
for ($i = 0; $i < 250000; $i++)
{
    // do nothing
}
echo xdebug_time_index(), "\n";
?>
Returns:
0.00038003921508789
0.76580691337585
xdebug_var_dump( mixed ...$variable ) : void #
Displays detailed information about a variable
This function displays structured information about one or more expressions that includes its type and value. Arrays are explored recursively with values. See the introduction of Development Helpers on which php.ini settings affect this function.
Example:
<?php
ini_set('xdebug.var_display_max_children', 3 );
$c = new stdClass;
$c->foo = 'bar';
$c->file = fopen( '/etc/passwd', 'r' );
var_dump(
    array(
        array(TRUE, 2, 3.14, 'foo'),
        'object' => $c
    )
);
?>
Returns:
array
  0 =>
    array
      0 => boolean true
      1 => int 2
      2 => float 3.14
      more elements...
  'object' =>
    object(stdClass)[1]
      public 'foo' => string 'bar' (length=3)
      public 'file' => resource(3, stream)